You're Viewing — Key Insights: 2025 Provider Compensation and Productivity Trends and Benchmarks
Would you like access to the full 15-page report? Become an MGMA member today to get full access to this report and much more. (Already a member? Login here.)
Key Insights: 2025 Provider Compensation and Productivity Trends and Benchmarks
While keeping physician and advanced practice provider pay aligned with expectations and market value may seem straightforward, designing compensation models that fit the complexities of medical practice operations is anything but simple.
- Primary care and surgical specialists in physician-owned practices were eclipsed by their counterparts in hospital-/system-owned practices in median work RVUs after years of private practices solidly outperforming on this measure of productivity.
- Guaranteed compensation for newly hired physicians out of residency and fellowship grew substantially in 2024, reflecting the increasingly competitive market for doctors.
- The prevalence of physician compensation plans based purely on salary and productivity/equal share continue to dwindle as quality metrics and other incentives figure heavily into the mix.
- Practices increasingly offer signing and starting bonuses, with increased willingness to extend them to APPs. Most now include full or prorated payback clauses on signing bonuses if providers don’t join the practice. This report highlights key benchmarks and emerging trends from the 2025 MGMA Provider Compensation survey, with 2024 data from more than 220,000 physicians and APPs nationwide.
Surgical Specialist Compensation
+5.57% YoY (2023–2024)
Median total compensation jumps from $554,108 in 2023 to nearly $585,000 in 2024
APP (PA and NP) Compensation (5-Year)
+19.39% (2020–2024)
Big 2024 productivity gains in private practices: +39.33% in encounters, +21.86% in work RVUs
Private Practice Primary Care Productivity
-6.23% compared to physicians in hospital-/IDS-owned groups
This despite private-practice PCPs having 16.12% more collections and 12.17% more total encounters
Know the right numbers to build a strong practice. As a federally recognized source to assist in fair market value, the MGMA DataDive Provider Compensation data set delivers targeted insights your practice needs to attract and retain top providers, drives more revenue through improved productivity, and helps contain costs. Examine physician and APP compensation across specialties and subspecialties to be competitive and consistent with the market when you are looking to hire or build a contract.
Productivity: Changes and Drivers
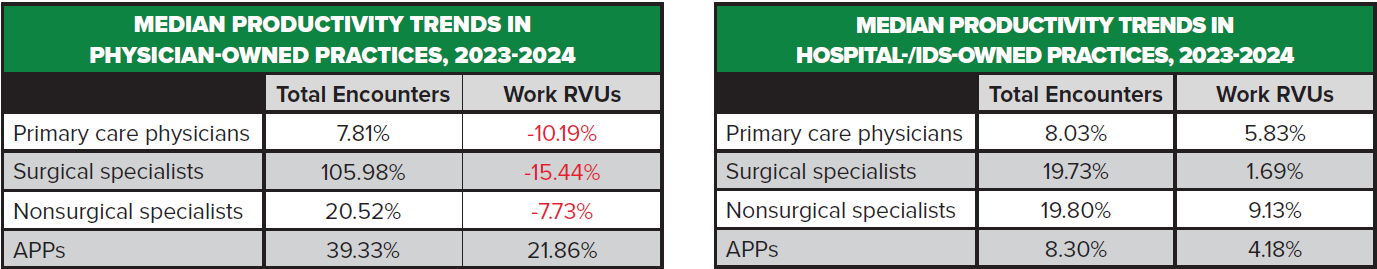
Physicians and APPs in physician-owned practices posted larger gains in total encounters compared to their counterparts in hospital-/system-owned practices, though the latter group of physicians in primary care and surgical specialties posted higher median work RVUs than those in private practices. Total encounters reflect all direct provider-to-patient interactions regardless of setting, including tele-visits and e-visits. Work RVUs (wRVUs) also quantify productivity and account for the complexity of the visits.
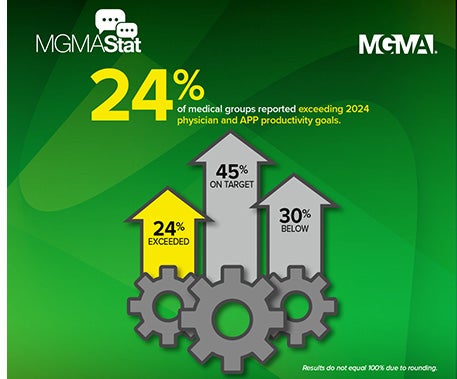
These benchmarks align with February 2025 MGMA Stat polling that found about 70% of medical groups met or exceeded their 2024 physician and APP productivity goals. Among poll respondents who reported that their physicians and APPs exceeded productivity expectations, most credited these gains to stronger scheduling practices, expanded capacity (staff, clinicians, hours) and targeted technology use (AI, telehealth, virtual scribes). However, many leaders pointed out the ongoing challenge of sustaining these improvements while managing burnout and maintaining staff satisfaction, emphasizing delicate balance between increasing productivity and avoiding excessive strain on clinicians and staff. Specifically:
• Practices that exceeded productivity goals often credited improvements in centralized scheduling, online patient scheduling and standardized templates.
• Multiple respondents noted that patient demand remains very high, to the point of often outpacing available staff. Some of these practice leaders told MGMA they are working to bolster support at a time when staff attrition is rising and staff satisfaction scores are worsening.

While there were modest gains in median wRVUs for physicians and APPs in hospital-/ system-owned practices, each of the three groupings for private-practice physicians were in the red, with only APPs in physician-owned practices posting median wRVU gains in 2024.
These data show signs that private practices largely continue to deliver more care but appear less productive.
Consider: In the realm of surgical specialists in private practice, total encounters grew by more than 105% yet resulted in a 15.44% decrease in median wRVUs in 2024, possibly signaling a shift to shorter, lower-wRVU procedures being performed, or possibly undercoding or documentation issues.
Especially interesting is the rising productivity of APPs in all settings, with a 39.33% increase in encounters and 21.86% increase in median wRVUs in private practices. Many physician owners have historically been wary of adding APP roles but seem to be ready to get more out of these clinicians.
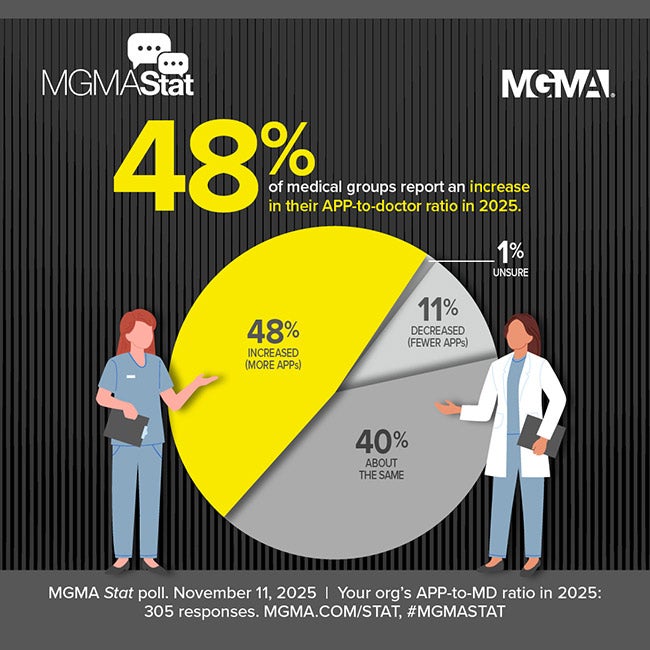
• This aligns with June 2024 MGMA polling that found nearly two-thirds of medical groups planned to add net new APP roles last year, as well as Kaufman Hall’s Q1 Physician Flash Report, which found that two out of every five healthcare providers — more than 40% — are APPs.
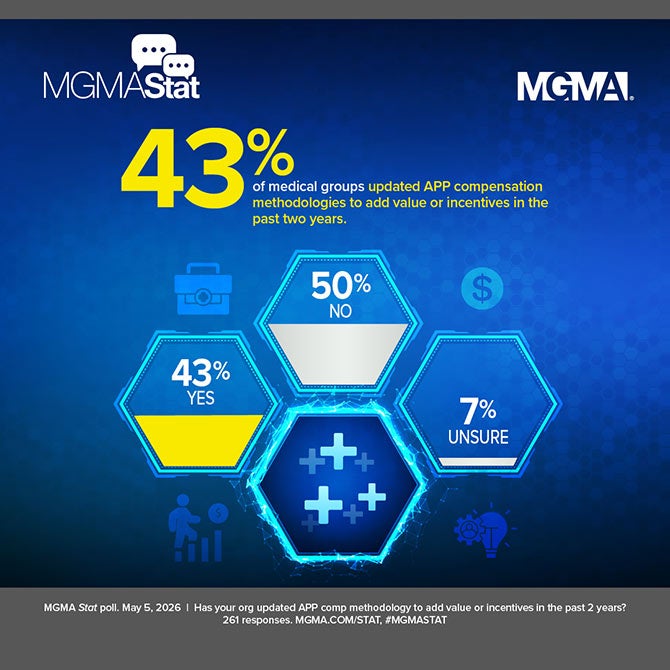
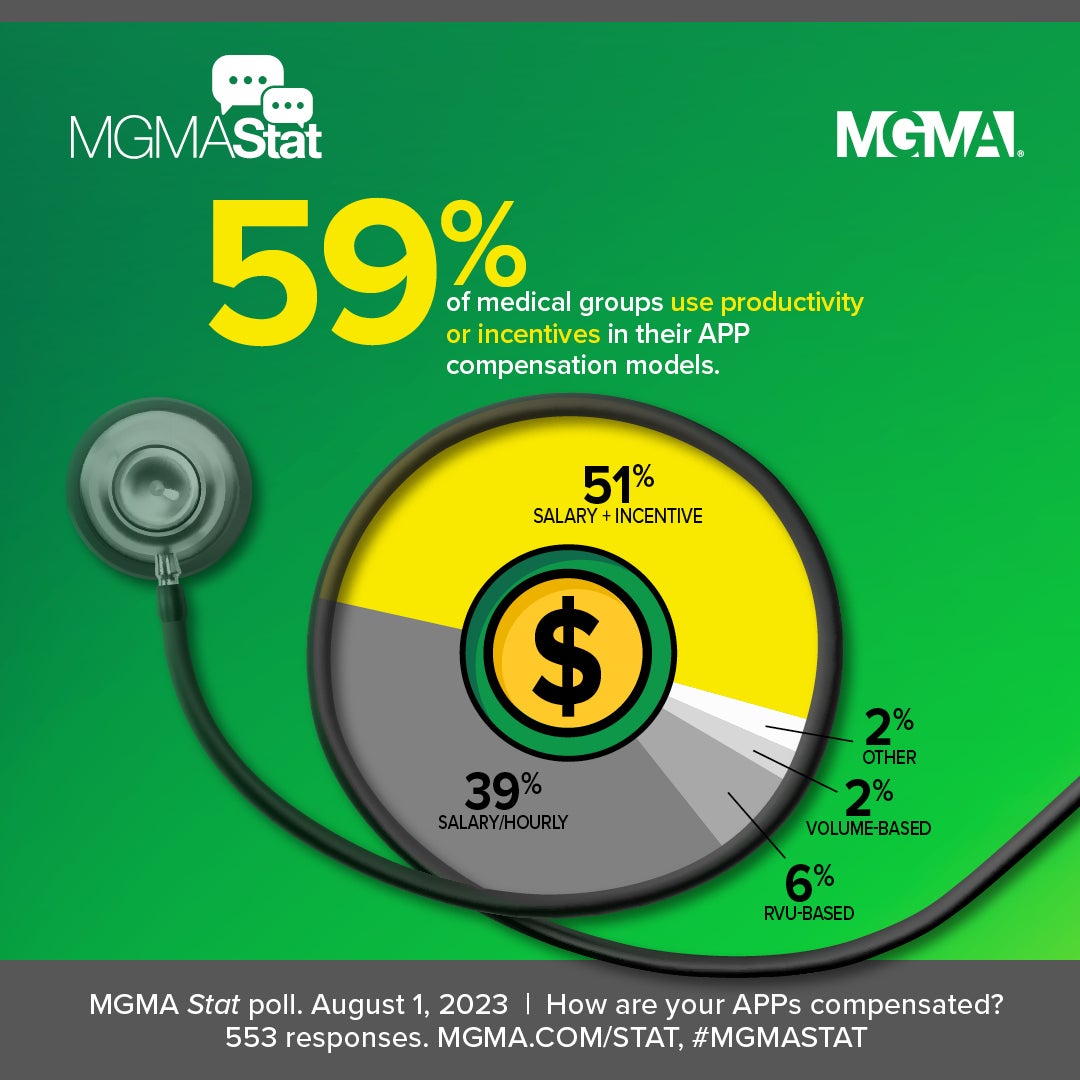
• It also echoes March 2025 polling in which 53% of practice leaders reported their APP compensation models are RVU-based, volume-based or have some form of incentive on top of a salary.
Physicians in private practice being busier — seeing more patients (likely shorter visits, less complex cases) and/or performing more lower-RVU services (which may still drive collections through volume) — is typical. Previous years’ survey data sets often found physicians employed in hospitals and systems seeing fewer patients but doing more high-RVU procedures per encounter, possibly due to:
- Payer mix and case mix differences (e.g., hospital referrals for sicker, more complex cases)
- Greater use of facility resources (e.g., bundled billing, more ancillary testing)
- Documentation practices that maximize coding under hospital/system compliance programs.
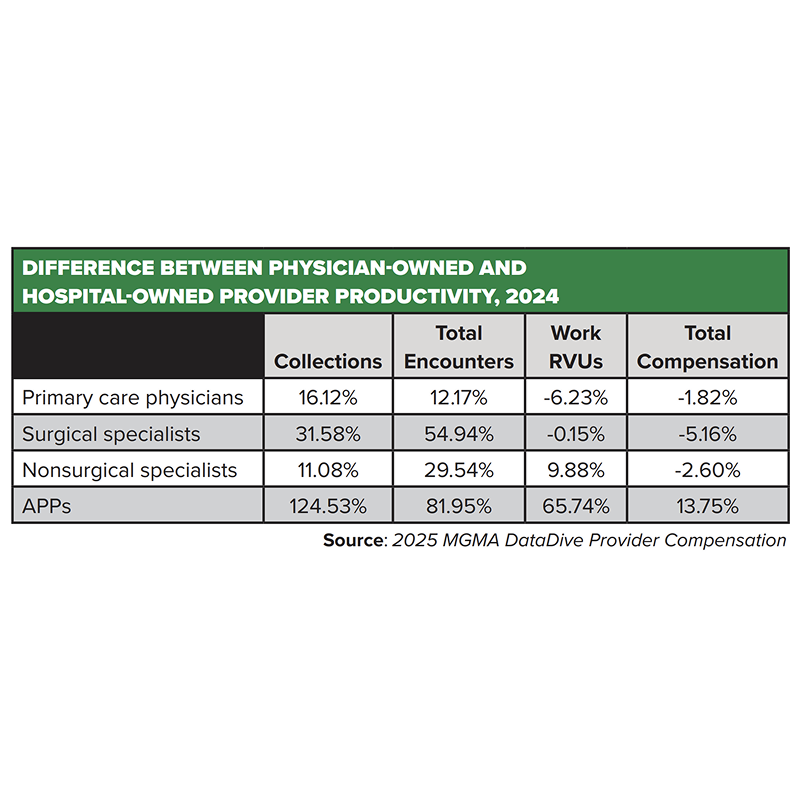
The 2024 data find providers in physician-owned practices seeing much higher total encounters and much higher collections than their counterparts in hospital-/system-owned practices, though mixed wRVUs comparatively (lower for PCPs and surgical specialists, higher for nonsurgical specialists and especially APPs) and lower total compensation (apart from APPs in private practice).
In 2024, APPs in physician-owned practices had strikingly higher wRVUs and compensation than those in hospital-owned groups, which would be consistent with more direct patient care, higher autonomy, and perhaps less supervision.
MGMA Members Get Much More
Get exclusive access to the full report:
- Three years of median total compensation benchmarks for PCPs, surgical and nonsurgical physicians
- One- and five-year change in compensation and work RVU trends for 23 specialties, including pediatrics, cardiology, OB/GYN, internal medicine, general surgery, neurology, and more
- Breakdowns of signing and starting bonus incentives for physicians and APPs, as well as median signing and starting bonus amounts for PCPs, surgical, and nonsurgical specialist physicians
- Comparison of physician compensation methods, as well as allocations of base salary versus productivity, quality, on-call and more for 2024
- MGMA analysis on collections differences across different ownership models
- One- and five-year changes in guaranteed compensation for newly hired post-residency/fellowship physicians
- One- and five-year change in median total compensation for nurse practitioners and physician assistants
- Regional data, including breakdown of the five-year change in median compensation for physicians and APPs by region.